📊 Dashboard
OpenUEM dashboard offers some charts about the last time the agents reported (in the last 24 hours), in which platform they are running, and which operating system version is used
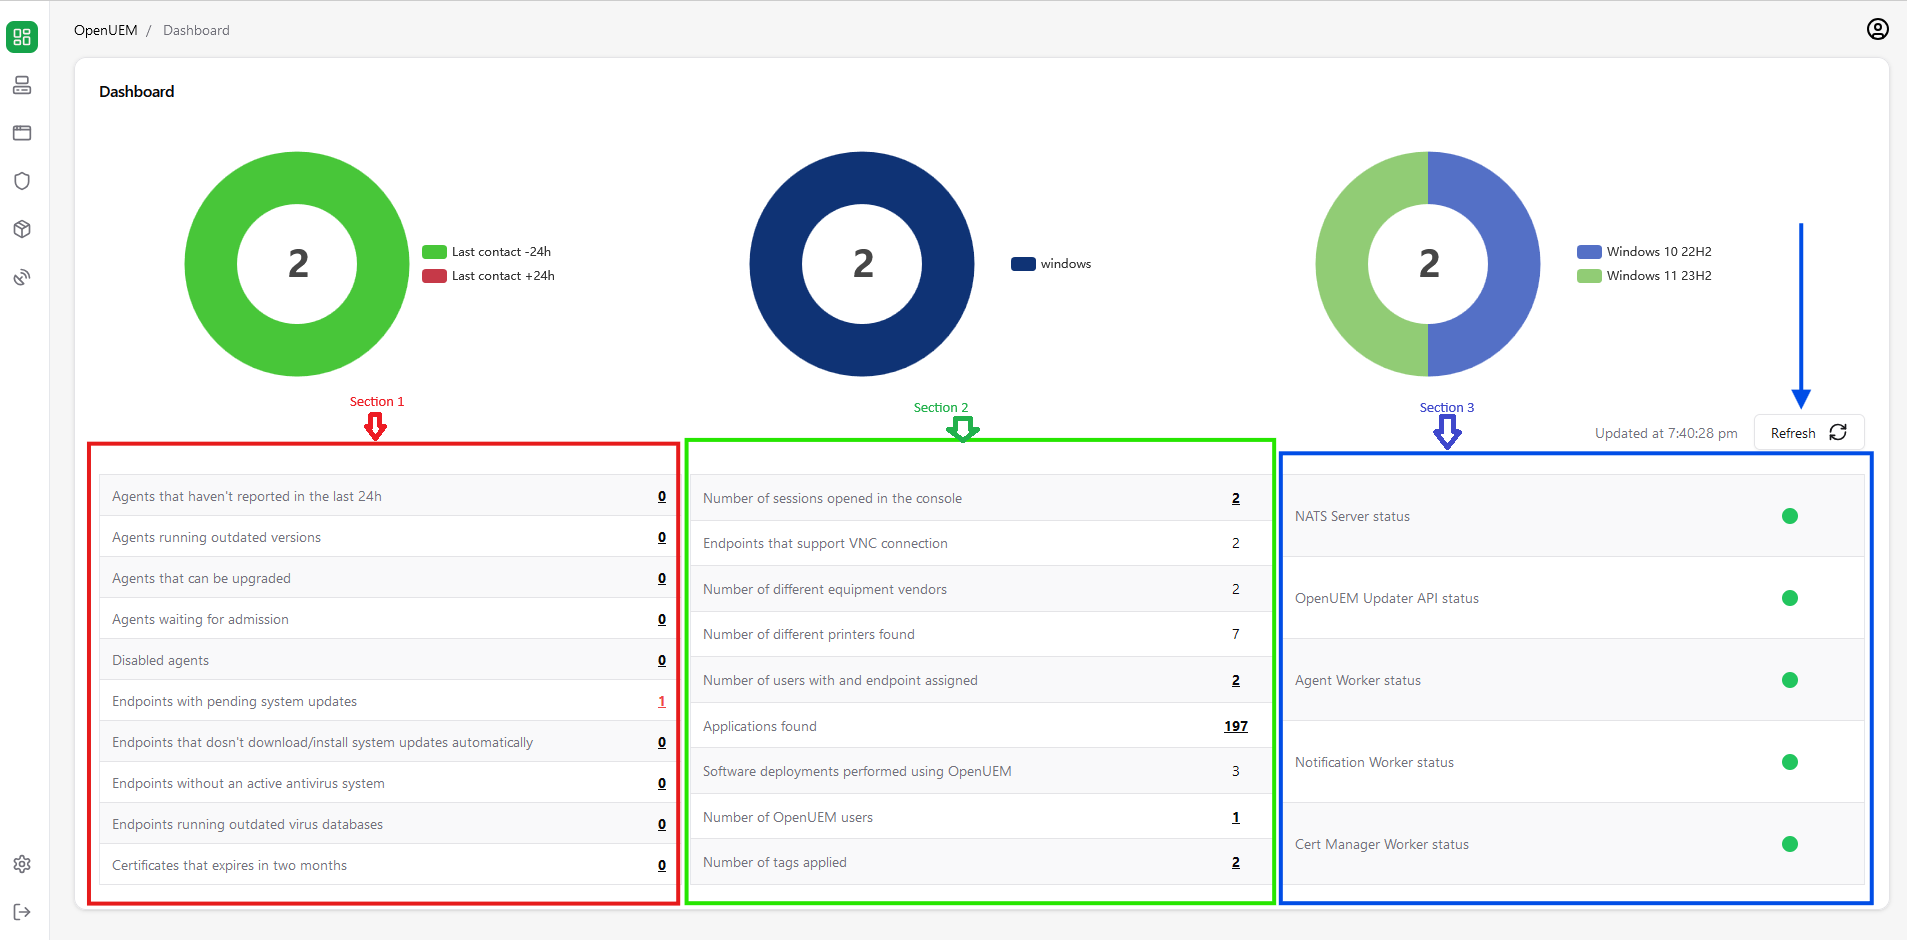
Under the charts you'll find three sections.
- Section 1 (in red) offers you information about things that you must worry about like agents that haven't reported, agents that have pending updates or disabled antivirus, agents that can be updated...
- Section 2 (in green) offers you some statistics about your environment like the number of users, the number of applications found, the number of tags applied...
- Section 3 (in blue) shows you the status of the different components that provide the OpenUEM service
The dashboard is refreshed automatically (every 5 minutes by default) but you can click on the Refresh button to get updated information.
Some numbers in the dashboard have a link that will lead you to the right Console section and probably with a filter applied.
Now, from the dashboard you can visit other sections using the Sidebar.